How to access
Totals
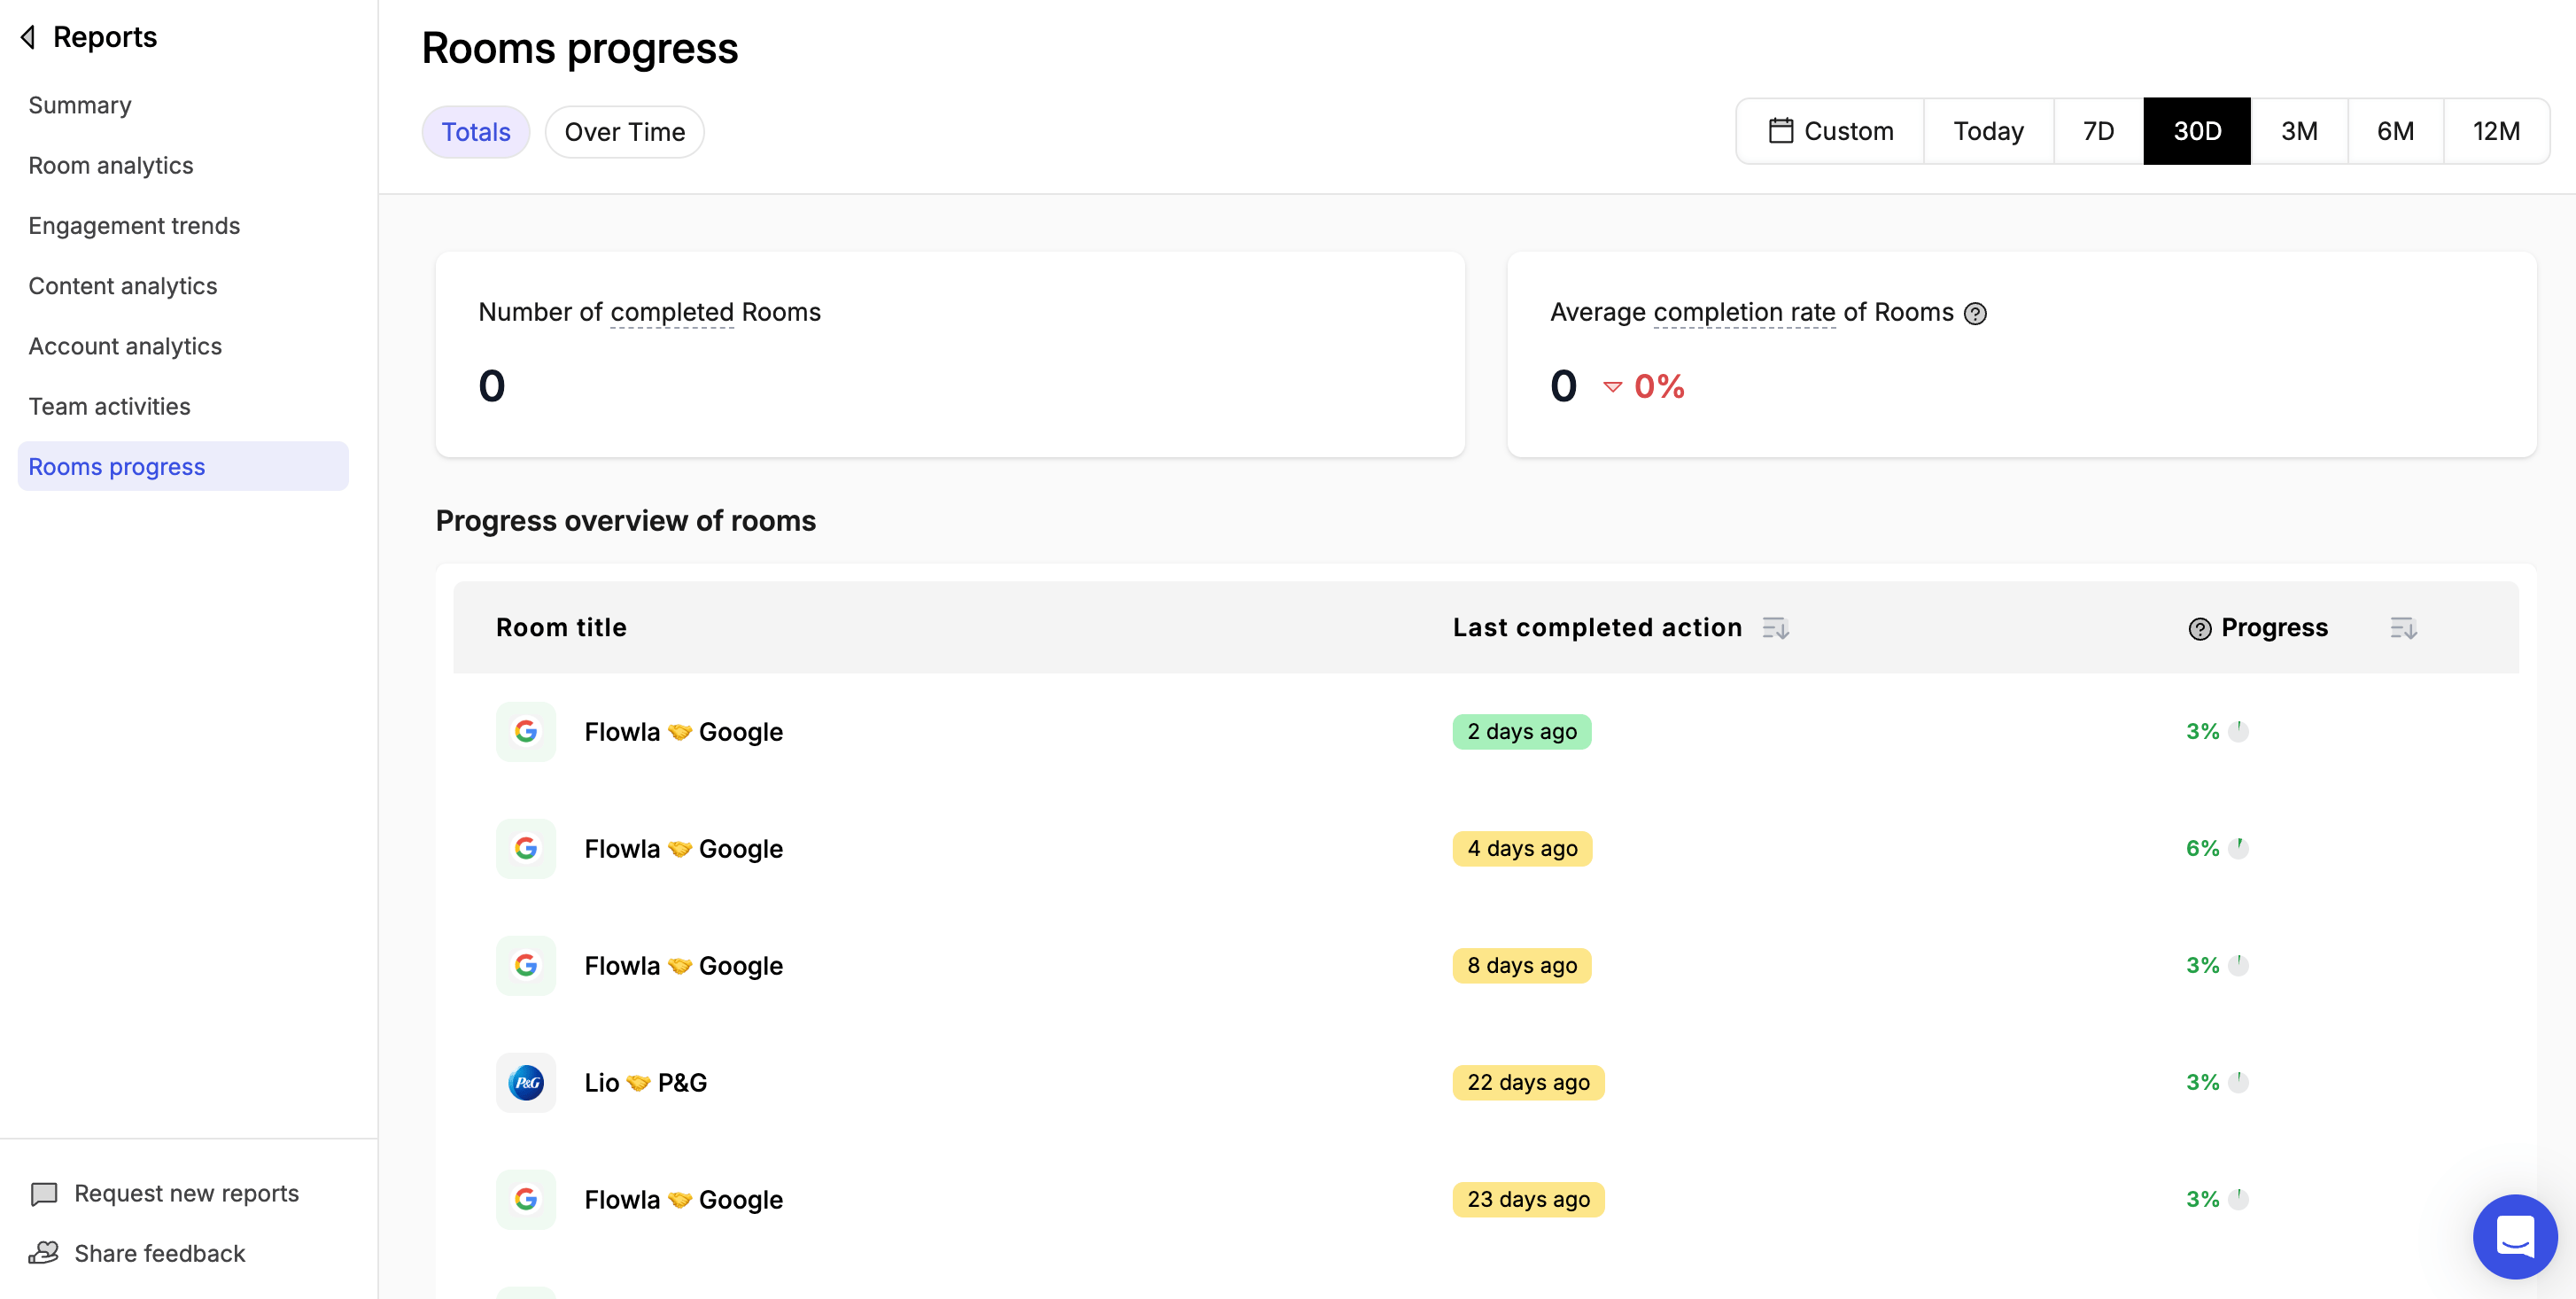
Number of completed rooms — Rooms where all actions have been completed in the selected time frame. Average completion rate of rooms — The average percentage of actions completed across all rooms. A low number across the board may indicate that action items need to be simplified or re-scoped. Progress overview of rooms — A table showing each room with its last completed action and overall progress percentage.Over time
Number of completed rooms over time — Completed rooms charted over the selected time period. Average completion rate of rooms over time — Average room completion rate charted over the selected time period.Filter by time period
- Last 7 days
- Last 30 days
- Last 90 days
- Custom date range